
KEY TAKEAWAYS
1. Sales compensation benchmarking is a revenue strategy, not an HR exercise. The strongest compensation plans don’t simply match market salaries. They align pay with the sales behaviors, performance goals, and growth strategy that drive long-term revenue. What is sales compensation benchmarking? Why is compensation benchmarking important? How does compensation affect revenue growth?
2. Benchmark the entire compensation plan—not just base salary. Competitive pay includes more than salary. Base pay, commissions, on-target earnings (OTE), pay mix, accelerators, bonuses, and incentives all influence how salespeople perform and whether they stay with your organization. What should be included in compensation benchmarking? What is OTE? How do you benchmark commission plans?
3. Compensation plans should evolve as markets change. Annual compensation reviews often leave organizations reacting to outdated assumptions. Regular benchmarking and performance analysis help companies adjust plans before recruiting, retention, or revenue suffer. How often should sales compensation be reviewed? Should commission plans change every year? How do companies keep compensation competitive?
4. Transparency builds trust with sales teams. Reps perform better when they understand how commissions are calculated, how earnings are tracked, and why compensation decisions were made. Confidence in the plan often matters as much as the payout itself. Why do commission disputes happen? How do you build trust in compensation plans? What makes a good commission plan?
__________________________________________
One of the quickest ways to lose a great salesperson is surprisingly simple. Pay them fairly…according to the wrong benchmark.
I’ve watched companies offer competitive salaries that still failed to attract top performers because the commission structure, pay mix, or earning opportunity didn’t reflect what the market actually valued. Great compensation isn’t about paying more. It’s about rewarding the right behaviors.
Here’s a number worth pausing on. According to recent research, 87.6% of human resources professionals at medium and large companies use salary benchmarks to set compensation. If you’re designing a sales comp plan without benchmarking data, you’re operating without critical market intelligence. You’re competing against nearly every other company in your market at a significant disadvantage.
Sales compensation benchmarking compares your company’s pay structures against the broader market. The goal is to ensure your plans are competitive, motivating, and aligned with revenue goals. Most teams either skip the process entirely or stop at pulling a few salary numbers from a survey. The real value of benchmarking isn’t in the data collection. It’s in knowing how to translate that data into a compensation plan that actually drives the behaviors your business needs.
This guide moves beyond surface-level comparisons. You’ll learn what sales compensation benchmarking really involves and why it matters for talent retention and revenue growth. We’ll cover the key components of a compensation plan that need to be measured against the market. From there, we’ll walk through a practical benchmarking process you can apply immediately. This includes data sources, analysis frameworks, and implementation strategies. We’ll also explore how artificial intelligence (AI) and real-time analytics are reshaping the way Revenue Operations (RevOps) teams approach compensation planning. These tools turn static annual exercises into dynamic systems that drive performance.
What Is Sales Compensation Benchmarking?
Sales compensation benchmarking compares your company’s sales pay practices against those of similar organizations in the market. But “the market” isn’t a single, uniform data set. It’s defined by the specific parameters that matter most to your business:
- Industry vertical
- Company size
- Geographic region
- The particular sales roles you’re hiring for
A Sales Development Representative (SDR) compensation package at a 50-person Software as a Service (SaaS) startup in Austin looks very different from one at a 5,000-person enterprise software company in New York. Benchmarking without defining your peer group is like comparing your marathon time to a cyclist’s. The numbers might be interesting, but they won’t tell you anything useful.
Benchmarking goes well beyond base salary. You’re evaluating the entire compensation package:
- Base pay
- Variable incentives
- On-target earnings (OTE)
- Pay mix ratios
- Accelerators
- Bonuses
- Non-cash benefits
Each of these elements sends a signal to your sales team about what behaviors the company values and rewards. When benchmarking is treated as a foundational element of strategic sales planning, it becomes a lever for aligning your go-to-market strategy with how you pay the people executing it.
Why Benchmarking Is Critical for Revenue Growth
Compensation benchmarking isn’t a nice-to-have HR exercise. It’s a revenue strategy. When your comp plans are misaligned with the market, the consequences show up in your sales pipeline, retention numbers, and ultimately, your revenue. Here’s why it matters.
Attract and Retain Top Talent
Your best candidates are evaluating multiple offers. If your OTE falls below the 50th percentile (the market median) for comparable roles, you’re losing deals before your recruiters even get to the negotiation table. Top performers know their market value, and they’ll go where the numbers make sense.
Motivate Performance
A compensation plan validated by market data feels fair and achievable. When reps trust that their targets and payouts are grounded in reality rather than arbitrary internal math, they’re more likely to stay engaged and perform through difficult periods.
Control Costs and Improve Return on Investment
Benchmarking isn’t just about paying more. It’s about paying smarter. You might discover you’re overspending on base salary for roles where a higher variable component would drive better outcomes. Or you might find that your accelerators are too generous relative to the value they’re generating.
Ensure Pay Equity
Objective, data-backed compensation decisions reduce the risk of bias creeping into your pay structures. Benchmarking provides the external reference point that keeps internal decisions grounded in market reality.
Companies that align their comp plans with market data see measurable improvements. Gainsight, for example, saw improved quota attainment by 10% after implementing a more integrated approach to planning and performance management through Fullcast.
The Key Components of a Sales Compensation Plan
Before you can benchmark effectively, you need to know exactly what you’re measuring. These are the core elements that define a sales compensation plan.
Base Salary
This is the fixed portion of a salesperson’s income, paid regardless of performance. Base salary varies significantly by role type, experience level, and geography. An enterprise Account Executive (AE) with eight years of experience will command a very different base than a first-year SDR. Your benchmarking data needs to account for these distinctions, or the comparisons become meaningless.
On-Target Earnings (OTE)
OTE represents the total compensation a rep can expect when they hit 100% of quota. The formula is simple: OTE = Base Salary + On-Target Commission. This is the single most common metric used for high-level compensation comparisons across the industry.
According to RepVue’s salary data, the median OTE for an SDR is $85,000 against a median base of $60,000. That gap illustrates just how much of a salesperson’s earning potential is tied to variable pay.
Commission Structure
The variable, performance-based component of compensation is where plan design gets interesting. Commission structures can take many forms:
- Straight-line commissions: Pay a flat percentage of revenue (for example, 10% of every deal closed)
- Tiered models with accelerators: Reward overperformance (for example, 10% up to quota, 15% for 100-120% of quota, 20% above 120%)
- Bonus-based structures: Tied to specific milestones (for example, $5,000 bonus for hitting quarterly target)
Commission rates typically fall in the 5-20% range depending on industry, deal size, and sales cycle length. Benchmarking your commission rates against peers helps you understand whether your variable pay is competitive enough to attract top sellers.
Pay Mix
Pay mix is the ratio of base salary to variable pay, often expressed as 50/50 or 60/40. The right mix depends on how much direct influence the rep has over the buying decision.
For example, an enterprise AE with a 60/40 pay mix earning $150,000 base would have an OTE of $250,000 ($150,000 base + $100,000 variable). A transactional SDR with a 50/50 mix earning $50,000 base would have an OTE of $100,000.
Roles with longer, more consultative sales cycles (like enterprise AEs) often lean toward a higher base component. Transactional roles with shorter cycles might skew more heavily toward variable pay. Getting this ratio wrong can either demotivate your team or inflate your fixed costs without driving additional revenue.
For a deeper dive into assembling these components into a cohesive strategy, explore how to build a sales compensation plan from the ground up.
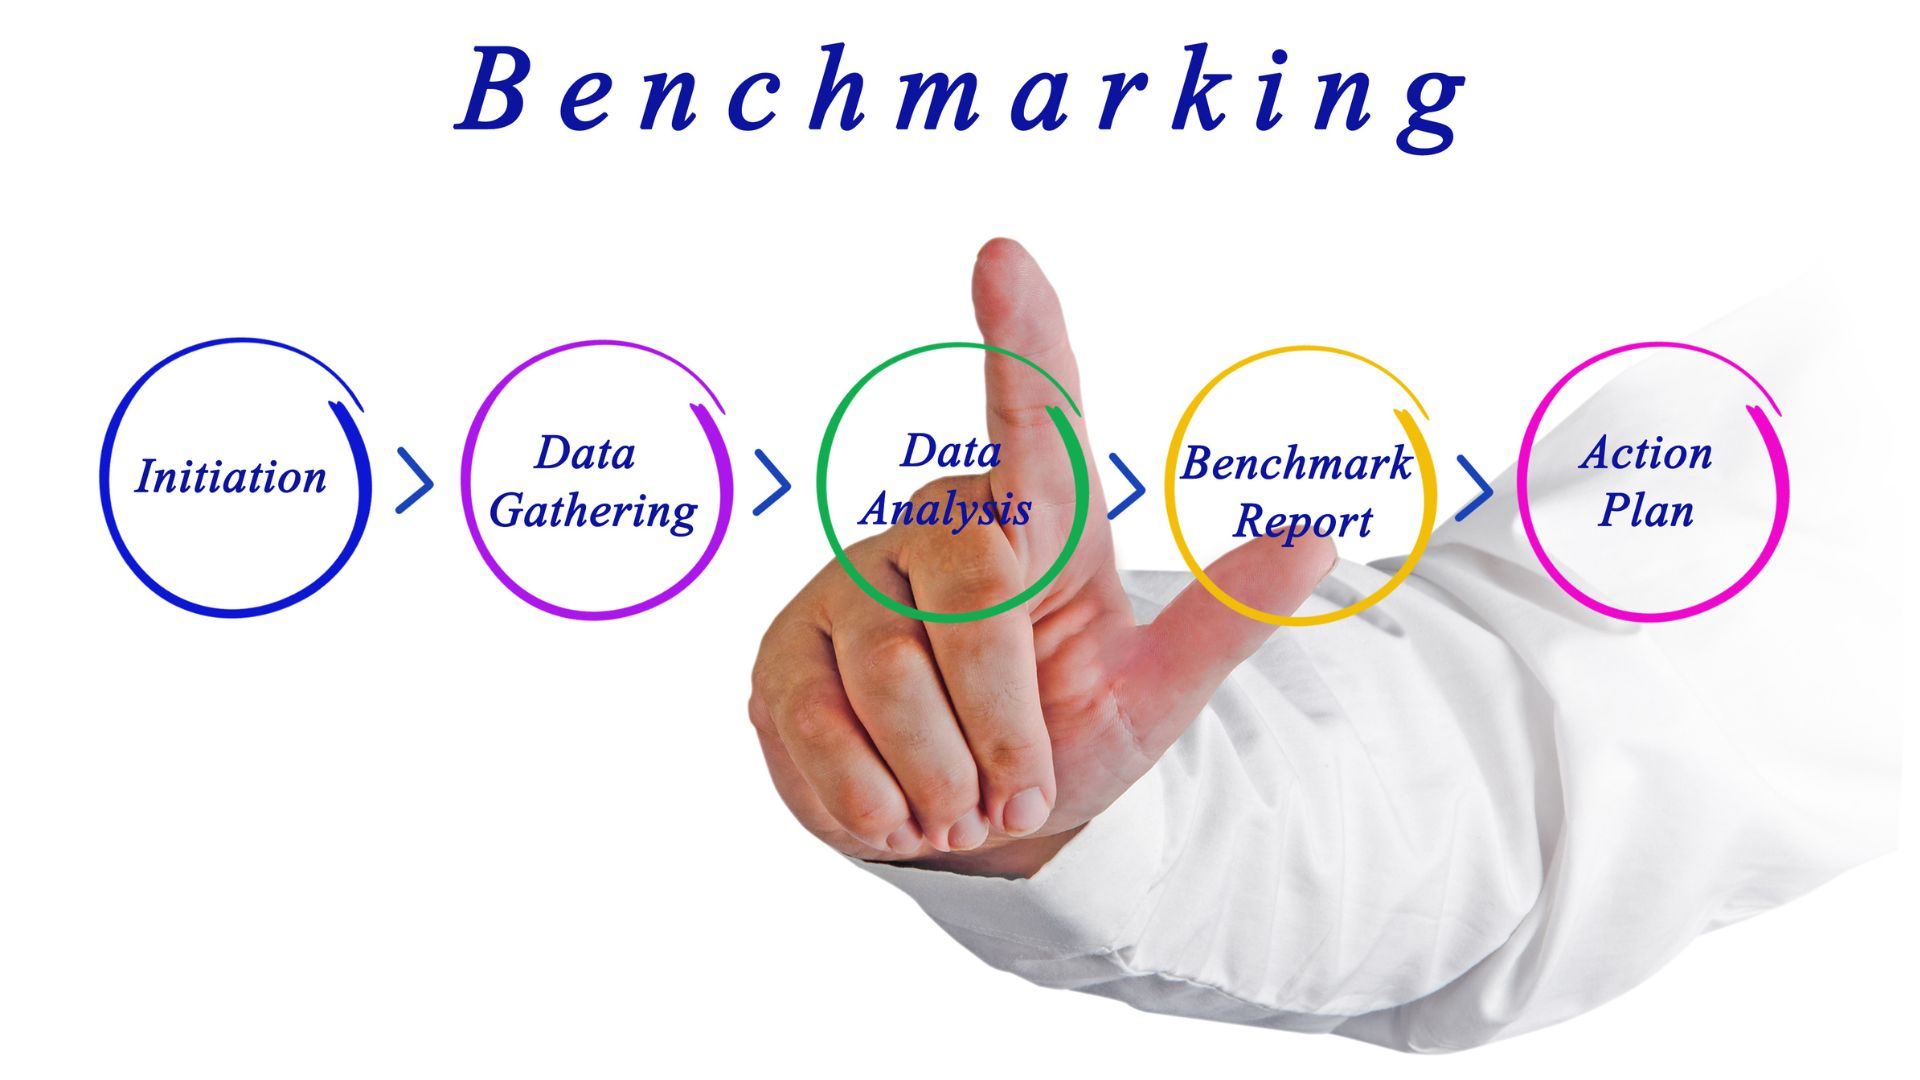
How to Conduct Sales Compensation Benchmarking: A Four-Step Process
Theory is useful, but process is what gets results. Here’s a practical framework you can apply to benchmark your sales compensation plans with confidence.
Step 1: Define Your Benchmarking Goals and Scope
Start by getting specific. Which roles are you benchmarking? SDRs, mid-market AEs, enterprise AEs, or sales managers? Each requires its own analysis.
Then define your peer group. Are you comparing against direct competitors, companies of a similar size and stage, or organizations in the same geographic market? The tighter your scope, the more actionable your findings will be.
Action item: Create a list of 10-15 comparable companies and the specific roles you want to benchmark before gathering any data.
Step 2: Gather Your Data
This is where most teams either over-invest or under-invest. You need a blend of sources to get a complete picture:
- Third-party salary surveys: Providers like Radford, Mercer, or Culpepper offer structured, role-specific data
- Public company filings: Can reveal executive and sales leadership compensation
- Recruiter insights: Provide current information on what candidates are actually being offered in the market
- Industry-specific resources: Fullcast’s 2025 Benchmark Report, which found the median OTE for Account Executives to be $280,000, delivers highly relevant data points tailored to go-to-market teams
Step 3: Analyze and Compare
With data in hand, map your current compensation plans against the 25th, 50th, and 75th percentiles for each role. The 25th percentile means 75% of companies pay more. The 50th percentile is the market median. The 75th percentile means only 25% of companies pay more.
This gives you a clear view of where you stand. If your AE OTE sits at the 30th percentile but you’re trying to hire top-quartile talent, you have a mismatch that needs addressing.
Decide where you want to position your company. Targeting the 75th percentile signals that you’re paying for premium talent. Sitting at the median keeps you competitive without overextending.
Step 4: Model and Implement Changes
Use your analysis to model potential adjustments. What happens to your cost structure if you shift your SDR pay mix from 60/40 to 50/50? How does adding an accelerator at 120% of quota impact projected payouts?
Once you’ve modeled the scenarios, implementation becomes the critical step. Rolling out changes requires clear, transparent communication with your sales team. Reps need to understand not just what changed, but why.
You need tools that ensure commissions are calculated accurately so that trust in the new plan isn’t undermined by payout errors on day one.
The Future of Compensation: AI and Real-Time Data
The shift from static to dynamic planning is a key theme among revenue leaders. As one RevOps expert noted:
“Companies often get stuck on national benchmark data, but the real magic happens when you can model how a small tweak to a commission accelerator will impact behavior in your specific territories. That’s the difference between a plan that’s ‘market-rate’ and a plan that actually drives growth.”
That perspective captures where compensation management is heading. Annual benchmarking cycles are giving way to continuous, data-informed adjustments powered by modern RevOps platforms.
AI-Driven Insights
AI enables leaders to move beyond looking at past performance data. Instead of waiting until year-end to discover that a commission structure underperformed, AI can analyze performance data in real time. It surfaces which reps are trending behind pace and whether structural plan changes could improve outcomes. This kind of analysis is powered by a performance analytics capability that helps leaders understand the reasons behind the numbers, not just the numbers themselves.
Real-Time Earnings Visibility
When reps can see exactly where they stand against quota and what their projected payout looks like at any given moment, it changes behavior. Transparency drives motivation in ways that a quarterly commission statement never could.
Integrated Planning
A well-designed comp plan based on real-time data doesn’t just motivate reps. It also leads to more predictable revenue and improved forecasting accuracy. Leadership can see how compensation-driven behaviors are translating into pipeline movement and closed deals. When territory design, quota setting, and compensation management live in the same system, the entire go-to-market operation runs more efficiently.
Conclusion: Go from Benchmarking to Breakout Performance
Benchmarking gives you the data. But data sitting in a spreadsheet never closed a deal or retained a top performer. The real advantage comes from turning those benchmarks into a compensation plan that’s integrated with your territory design, quota setting, and performance management in one system.
That’s the core idea behind Fullcast’s Revenue Command Center. Instead of juggling disconnected data points across spreadsheets and separate tools, you can manage the entire revenue lifecycle from Plan to Pay in one platform. It’s the difference between knowing where the market sits and actually building a comp plan that outperforms it.
You’ve seen the framework. You understand the components. You know where to find the data. The next step is putting it all into action with tools that connect your compensation strategy directly to revenue outcomes.
Ready to see how it works? Schedule a demo of Fullcast today.
FAQ
1. What is sales compensation benchmarking?
Sales compensation benchmarking is the process of comparing your company’s sales pay practices against similar organizations in the market. It evaluates the entire compensation package including base pay, variable incentives, on-target earnings, pay mix ratios, accelerators, bonuses, and non-cash benefits, not just base salary.
2. Why does sales compensation benchmarking matter for revenue growth?
Sales compensation benchmarking matters for revenue growth because it directly impacts your ability to build and retain a high-performing sales team. Compensation benchmarking is a revenue strategy, not just an HR exercise. It helps companies attract and retain top talent, motivate performance, control costs, improve ROI, and ensure pay equity through objective, data-backed compensation decisions.
3. What are the key components of a sales compensation plan?
The core elements of a sales compensation plan include:
- Base salary: Fixed portion paid regardless of performance
- On-target earnings (OTE): Base salary plus on-target commission
- Commission structure: Variable, performance-based component
- Pay mix: The ratio of base salary to variable pay, often expressed as 50/50 or 60/40
4. What is the process for benchmarking sales compensation?
A practical framework includes four steps:
- Define benchmarking goals and scope by specifying roles and peer groups
- Gather data from salary surveys and industry reports
- Analyze and compare current compensation against market percentiles
- Model and implement changes with clear communication to your sales team
5. Where can I find reliable data for sales compensation benchmarking?
Reliable data sources include:
- Third-party salary surveys from providers like Radford, Mercer, or Culpepper
- Public company filings for executive and sales leadership compensation
- Recruiter insights for real-time market pulse
- Purpose-built industry benchmark reports
6. How should I determine the right pay mix for different sales roles?
The right pay mix ratio depends on how much direct influence the rep has over the buying decision. Roles with longer, more consultative sales cycles often lean toward a higher base component (such as 60/40 or 70/30 base-to-variable), while transactional roles with shorter cycles might skew more heavily toward variable pay (such as 50/50 or 40/60 base-to-variable).
7. What are common mistakes companies make when benchmarking sales compensation?
The most frequent mistakes include skipping the benchmarking process entirely or stopping at pulling a few salary numbers from a survey. Benchmarking without defining your peer group produces meaningless comparisons. The real value comes from translating data into compensation plans that drive desired behaviors, not just collecting numbers.
8. How is AI changing sales compensation planning?
AI is enabling a shift from static annual benchmarking cycles to continuous, data-informed adjustments powered by modern RevOps platforms. According to recent industry research, organizations are increasingly adopting:
- AI-driven insights for real-time performance analysis
- Real-time earnings visibility for reps
- Integrated planning that connects territory design, quota setting, and compensation management